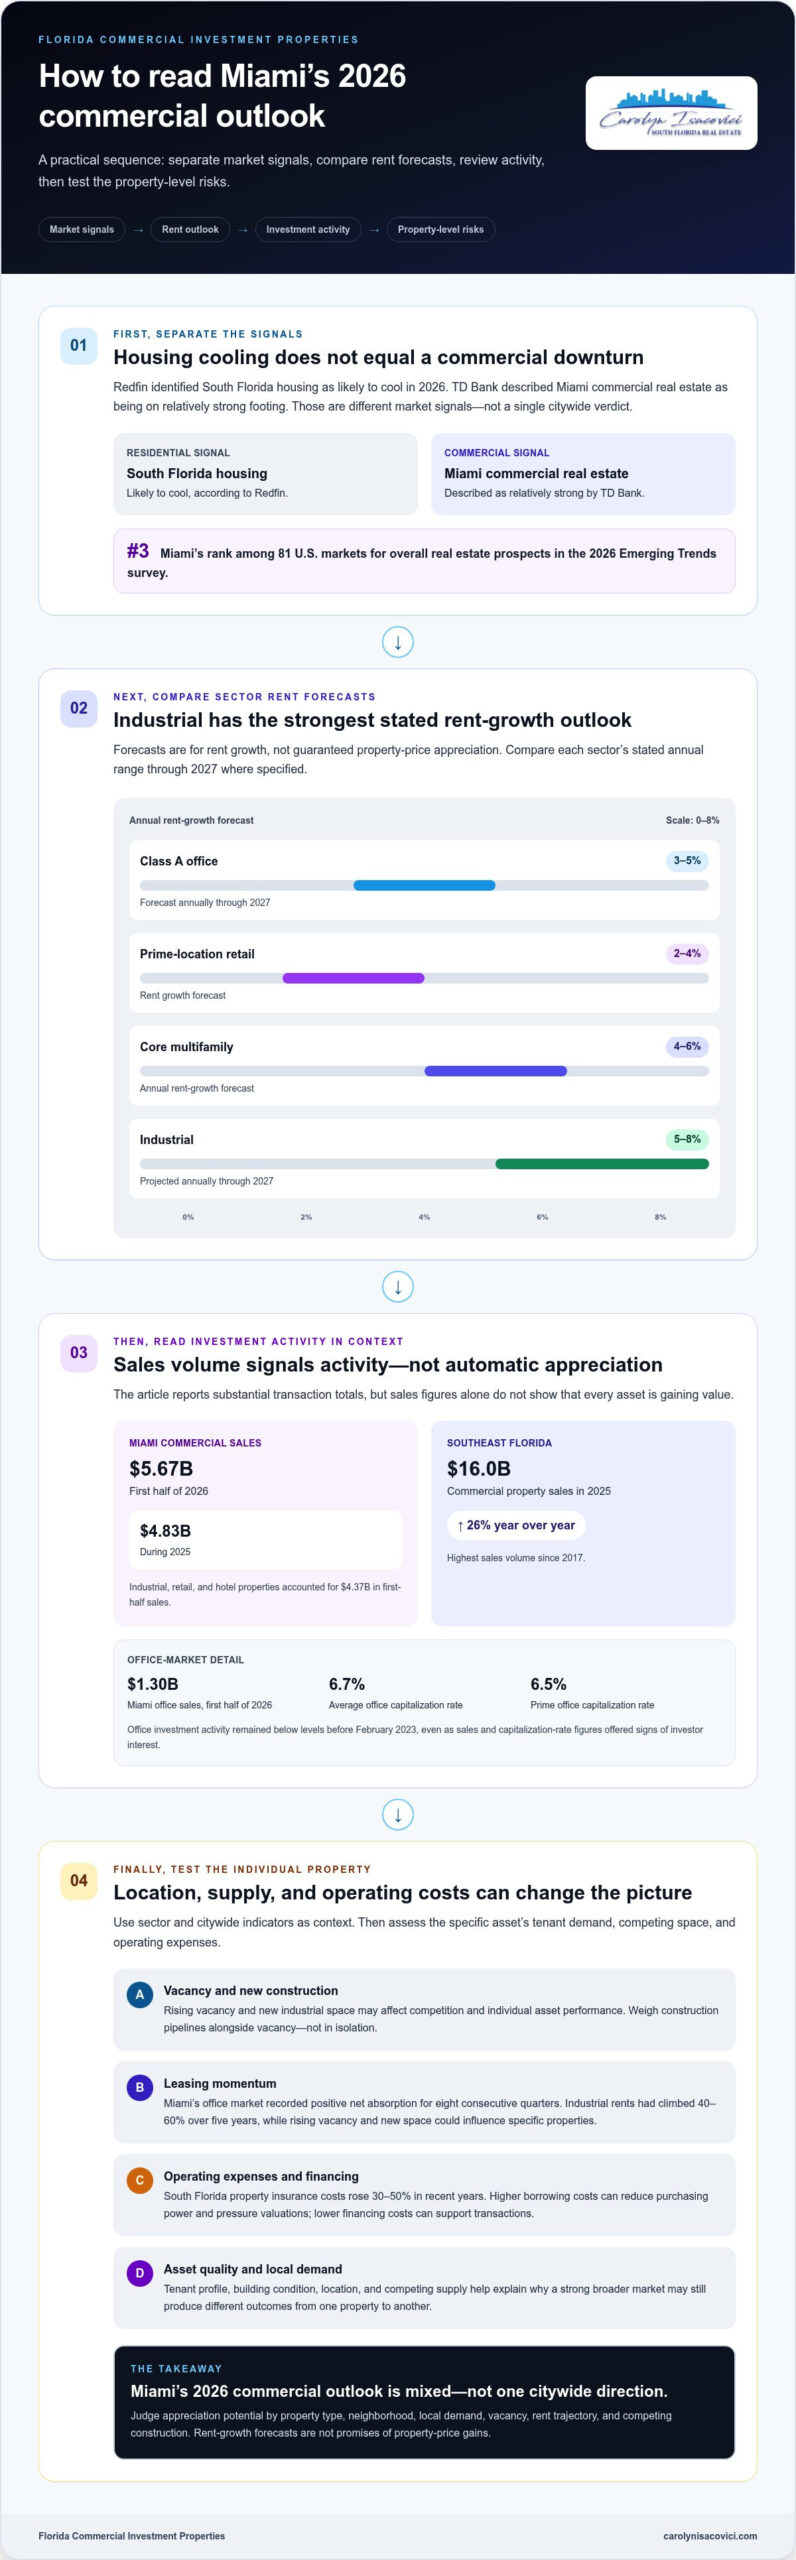
A cooling housing market doesn’t automatically mean Miami commercial property values are headed down. The commercial real estate appreciation forecast for Miami in 2026 is mixed but broadly resilient: Redfin identified South Florida as a housing market likely to cool, while TD Bank described Miami commercial real estate as being on relatively strong footing. Miami also ranked third among 81 U.S. markets for overall real estate prospects in the 2026 Emerging Trends survey.
That distinction matters. Commercial performance depends on more than residential prices: office demand, vacancies, new construction, and neighborhood conditions all shape the outlook. Miami’s office market recorded positive net absorption for eight consecutive quarters, while industrial development is adding space that could affect competition and property values.
So, are prices likely to fall? The clearest answer is that Miami’s 2026 outlook isn’t uniform across property types or locations. This article explains how office performance, neighborhood-level demand, vacancy rates, construction pipelines, and development trends can affect appreciation, helping you read the market with greater clarity.
Key Takeaways
- Separate residential price cooling from commercial property performance; property type and local demand can point to different outcomes.
- Compare neighborhood value signals carefully: pricing advantages in areas such as Glenvar Heights and Biltmore Heights may offer a different entry point than nearby premium markets.
- Use vacancy and construction together to assess competition: tight prime retail and industrial corridors face a different outlook from sectors adding substantial new space.
- Look beyond asking prices when assessing investment prospects; sales activity, capitalization rates, and leasing demand help show where investors are placing confidence.
- Use the rent-growth outlook by property type to frame expectations, then weigh each opportunity against its location, tenant demand, and supply pipeline.
Are Miami real estate prices going down in 2026?
Not across the board. Redfin identified South Florida housing as likely to cool in 2026, while TD Bank described Miami commercial real estate as being on relatively strong footing. Miami ranked third among 81 U.S. markets for overall real estate prospects in the 2026 Emerging Trends survey. The commercial real estate appreciation forecast for Miami in 2026 therefore depends on property type, neighborhood, and local demand, rather than one citywide direction.
How do office, industrial, retail, and multifamily appreciation forecasts compare for 2026? Available forecasts point to rent growth, not guaranteed property-price appreciation: Miami Class A office rents are forecast to grow 3-5% annually through 2027, prime-location retail rents 2-4%, and core multifamily rents 4-6% annually. Industrial rents are projected to grow 5-8% annually through 2027, giving that sector the strongest stated rent-growth outlook.
Florida’s housing figures add useful context, but they describe homes, not commercial buildings. The state had about 4.7 months of housing supply in 2026, below the six months associated with a balanced Florida market. Florida homes averaged about 44 days on the market in 2026, while HouseCanary projected prices to remain largely flat through year-end. Those measures suggest moderation, not a uniform decline across the real estate market.
Miami-Dade’s July 2025 figures show why conditions can vary by property type. Single-family homes had a 6.6-month supply, while condos had a 14.1-month supply. Total active listings increased 33.5% year over year, yet county inventory remained 15.6% below pre-pandemic levels. MIAMI REALTORS® Chief Economist Gay Cororaton expected a buyer’s market to continue through mid-2026, particularly relevant to buyers comparing listings and negotiating terms.
Time on market also signals a slower pace. Miami-Dade single-family homes took 85 days to sell in July 2025, up from 72 days a year earlier. Across Florida, the 2026 average was 44 days, a different measure and period. In the Miami market framework, list-to-sale discounts of 5% or less indicate acceleration. Buyers can use that threshold alongside listing time, inventory, and property condition to assess whether an asking price reflects current demand.
Industrial trends remain distinct from housing. Miami industrial rents had climbed 40-60% over five years, supporting investor interest, though rising vacancy and new space may affect individual assets. Luxury housing demand, limited land, and international interest also influence Miami values, but don’t guarantee commercial appreciation.
For a practical 2026 assessment, compare each property’s sector, submarket, vacancy, rent trajectory, and competing construction. Miami’s housing signals show more buyer choice in some categories, while commercial indicators remain mixed. That combination makes neighborhood-level analysis more useful than assuming every Miami asset will rise or fall together.
Miami’s 2026 investment and development outlook
Miami’s investment outlook combines population growth with stronger activity across several commercial property sectors. Population growth can support demand for places to live, shop, work, and move goods, though its effects vary across property types and locations. That growth can strengthen well-located assets, but it doesn’t make every property equally attractive. Investors still need to weigh tenant demand, operating costs, building quality, and the supply of competing space.
Recent sales figures show rising transaction volume. Miami commercial real estate sales totaled $5.67 billion in the first half of 2026, compared with $4.83 billion during 2025. Industrial, retail, and hotel properties accounted for $4.37 billion in first-half sales. Across Southeast Florida, commercial property sales reached $16.0 billion in 2025, up 26% year over year, the highest volume since 2017. These totals signal investor activity, not automatic appreciation for each asset.
Quality remains a key consideration. Miami office sales reached $1.30 billion in the first half of 2026, while average office capitalization rates compressed to 6.7%; prime office rates reached 6.5%. Yet office investment activity remained below levels before February 2023. Those signals suggest investors are selective: a strong location, tenant profile, and building condition can matter more than broad market momentum. The 2026 survey also showed solid investor interest in hotels, retail, and office properties, with more caution toward apartment acquisitions.
How could interest rates, insurance costs, and property taxes affect Miami commercial real estate appreciation in 2026? Higher borrowing costs can reduce purchasing power and put pressure on valuations, while lower financing costs can support transactions. South Florida property insurance costs have risen 30-50% in recent years, increasing operating expenses, and a proposed constitutional amendment concerning some local property taxes would not take effect in 2026 if approved by voters.
What are the main risks to Miami commercial real estate appreciation forecasts for 2026? Rising insurance expenses, additional competing supply, and weaker tenant demand can limit income growth and weigh on values. Construction also needs close attention: additions to the market can create opportunity where demand absorbs them, but challenge existing properties when new space competes for tenants.
What do recent Miami commercial property sales and market reports indicate about 2026 appreciation? The $5.67 billion first-half sales total and compressed office capitalization rates point to active investment and confidence in selected assets. They don’t establish a single appreciation rate; property-level income, costs, location, and buyer demand determine how those signals translate into value.
For an investment decision, compare expected income with recurring expenses, nearby development, and the asset’s ability to attract tenants. A focused commercial property investment review can help connect those factors to a purchase or sale strategy.
Five-year value increases by Miami neighborhood
Neighborhood comparisons offer useful context, but the available figures describe relative pricing and inventory, not five-year appreciation rates. Biltmore Heights is approximately 25-30% cheaper per square foot than Coral Gables, while Glenvar Heights has an approximately 25% pricing advantage over South Miami and Coral Gables. These differences can help buyers compare entry points, but they don’t show how much either area’s values have risen over five years.
In Kendall, the Baptist / Galloway area is priced up to 30% below Pinecrest. That gap may help buyers weighing a lower initial purchase price against neighborhood preferences. It shouldn’t be treated as a forecast of future performance: property condition, location within the neighborhood, and demand for a particular asset can all shape its value. An interest rate change can also influence buyer budgets and competition, affecting how quickly comparable properties transact.
Inventory tells a different part of the story. Coconut Grove and Coral Gables have less than three months of inventory in the $3 million to $6 million price tier. That limited supply can give sellers leverage when qualified buyers compete for suitable properties. Pinecrest upper-tier listings, by contrast, have list-to-sale discounts in the 10-14% range, giving buyers negotiating room. These measures describe different submarkets and price tiers, so they shouldn’t be read as a direct neighborhood ranking.
Miami-Dade’s longer-term record shows how much values can change across a market cycle. Single-family home prices increased 138.3% from July 2015 to July 2025. That decade-long county figure provides context, but it isn’t a five-year result or a neighborhood-level forecast. Housing trends in Coral Gables, Pinecrest, and Kendall can diverge as supply, property type, and buyer demand shift.
Luxury sales offer another signal, but they are not a broad benchmark. One exceptional transaction cannot establish typical values across Miami neighborhoods or predict appreciation for commercial assets. When comparing luxury properties, focus on sales of similar properties in comparable locations with similar features.
To assess five-year neighborhood performance, compare the same property type across matching dates, then review recent comparable sales and current inventory. Keep price-per-square-foot gaps separate from actual value growth. For example, Biltmore Heights’ discount to Coral Gables identifies relative affordability, while the 138.3% county increase measures a historical period. Neither figure alone predicts a future return.
Population growth can support demand, but its effect varies by location and property. A careful comparison of neighborhood supply, buyer interest, and asking-to-sale discounts gives a clearer picture than one citywide appreciation claim. For 2026 decisions, treat relative pricing as a starting point, then test whether local demand and comparable transactions support the property’s valuation.
Miami commercial vacancy rates and construction
Vacancy and new construction reveal how supply may shape Miami’s commercial property values. South Florida commercial real estate vacancy rates are lower than national rates, but conditions differ by sector and submarket. Miami’s office vacancy was 14.3% in early 2026, while direct office vacancy measured 11.4% in the first half of 2026. These figures describe different snapshots and measures, so compare them with consistent reporting periods when evaluating an asset.
Core office locations offer a more focused picture. Class A office vacancy in Miami’s core submarkets is 8-12%, below the national average of 15% or more. Miami recorded approximately 160,000 square feet of positive office net absorption during the first half of 2026. Net absorption has also remained positive for eight consecutive quarters. Together, these trends point to tenant demand, though vacancies still vary between buildings and locations.
Industrial space shows the clearest contrast between tight prime corridors and broader regional supply. Vacancy in Miami’s prime industrial logistics corridors is below 3%, while 8-10 million square feet of industrial space is under construction in Miami. South Florida industrial vacancy reached 5.7% in Q4 2025, up from 4.8% the year before. The region’s broader vacancy figure and Miami’s prime-corridor measure cover different areas, but both matter: scarce logistics space may support existing properties, while new deliveries can increase tenant choice.
Retail remains comparatively tight in sought-after areas. Average retail vacancy in Miami’s prime corridors is 4-6%, while South Florida regional retail vacancy ranged from 3.2% to 3.5% in Q1 2026. For a property owner, low vacancy can support leasing leverage when space suits local demand. For a buyer, the same tight supply may limit available options. Check whether a property competes in a prime corridor or the wider county market before drawing conclusions.
Use a three-part comparison to interpret these market trends: identify the property’s sector and submarket, compare its vacancy with the closest relevant measure, then assess planned construction competing for the same tenants. For example, a Miami logistics asset in a corridor with vacancy below 3% faces a different supply picture from a building assessed against South Florida’s 5.7% industrial vacancy. Asking rents, tenant retention, and building quality help explain that difference.
Construction is not automatically positive or negative for appreciation. New supply can attract businesses and support growth when demand absorbs it; competing space can put pressure on occupancy and rent expectations when supply outpaces demand. Miami’s office absorption, tight prime retail availability, and industrial construction pipeline point to different balances by sector. Evaluate vacancies alongside future deliveries in the specific submarket rather than treating one regional rate as a forecast for every Miami property.
What are Miami commercial property price and rent growth forecasts for 2026?
Miami’s 2026 outlook points to rent growth across several commercial sectors, but rent forecasts aren’t property-price forecasts. Class A office rents are forecast to grow 3-5% annually through 2027. Prime-location retail rents are forecast to grow 2-4%, while core multifamily rents are expected to grow 4-6% annually. For owners, rising rental income can support value when occupancy and operating costs remain favorable.
Industrial rents have the strongest stated growth outlook. Miami industrial rents are projected to grow 5-8% annually through 2027, reflecting demand for logistics space. Yet a rent increase alone doesn’t determine appreciation. Buyers and owners should also consider lease terms, tenant stability, vacancy, and upcoming construction. New competing space can limit rent gains, even in a sector with positive demand.
Office performance shows why location and building quality matter. Market averages can conceal a gap between the wider market and premium space, so an office property’s class and submarket help shape its rent potential.
Retail’s 2-4% forecast applies to prime locations, not every storefront. Miami-Dade retail leasing deal volume totaled approximately 1.27 million square feet in the first half of 2026, down 1.7% year over year. That modest decline adds context to the forecast: assess the corridor, tenant mix, and available competing space before applying a prime-location outlook to a specific property.
Multifamily rents have a different balance. Core Miami submarkets are forecast to see 4-6% annual rent growth, while Miami multifamily effective rents declined 0.3% year over year in Q2 2026. The contrast shows why a forecast should be weighed against current performance. Occupancy, concessions, new supply, and neighborhood demand affect whether projected growth translates into stronger property income.
For the commercial real estate appreciation forecast for Miami in 2026, treat rent growth as one input to valuation, not a guaranteed sale-price increase. Property value also responds to operating expenses, vacancy, lease quality, and investor demand. Compare the asset’s current income with realistic rent expectations, then consider whether local construction could change competition before leases renew.
Use the sector forecasts to frame an acquisition or sale decision, then test the assumptions against the property’s location and income profile. Review Miami commercial property opportunities with those rent-growth differences in mind.
Florida Commercial Investment Properties: Commercial Property Sales
Florida Commercial Investment Properties offers Commercial Property Sales for buyers and owners considering Miami assets in light of 2026 market conditions. If you’re weighing a purchase or sale, comparing local demand, vacancy, rent prospects, and competing construction can help clarify how an individual property fits the broader outlook.
Florida Commercial Investment Properties handles investment property and residential real estate sales, as well as sales of new construction homes. These services can support different goals, whether you’re evaluating a commercial investment, buying or selling a home, or considering a newly built property. Start by connecting neighborhood conditions with your objectives and the asset’s income potential.
For guidance on a Miami property purchase or sale, contact Florida Commercial Investment Properties.
Turn Miami’s 2026 outlook into a clear next step
Use the commercial real estate appreciation forecast for Miami in 2026 as a planning framework, not a substitute for assessing the property in front of you. Before moving forward, define what success means for your investment, identify the income and ownership priorities that matter most, and decide which trade-offs fit your plans. A clear set of priorities can help you evaluate opportunities with discipline as market conditions evolve.
Florida Commercial Investment Properties supports property decisions through commercial property sales, residential real estate sales, and sales of new construction homes. Whether you’re considering a commercial acquisition, a residential transaction, or a newly built home, align your next step with your goals and the property you’re evaluating.
Contact Florida Commercial Investment Properties to discuss your next property decision. With a thoughtful plan and a clear view of your priorities, you can approach Miami’s changing market with confidence and focus.
Frequently Asked Questions
How Does Miami Compare to the National Outlook?
Miami’s overall real estate prospects rank near the top of the national market. In the 2026 Emerging Trends survey, Miami placed third among 81 U.S. markets. The average score across those markets was 2.81 on a five-point scale, compared with 3.08 for the 15 primary markets. For investors, this favorable ranking is a useful screening signal, not a substitute for comparing a property’s income, location, and operating costs.
How is 2026 shaping up?
Miami’s 2026 outlook is active but uneven, with commercial opportunities varying by property type and neighborhood. Investors can make the picture more practical by testing a prospective asset under different leasing scenarios: consider how income changes if a tenant leaves, a lease renews at different terms, or competing space opens nearby. That approach helps reveal whether a property’s projected performance depends on one optimistic assumption or has room to adapt.
What is the 2026 commercial real estate appreciation forecast for Miami?
There is no single commercial property appreciation rate for Miami’s offices, shops, warehouses, and apartments. Rent forecasts provide useful direction, but appreciation also depends on net operating income, expenses, lease quality, and the capitalization rate buyers apply. For example, two buildings with similar rent growth may follow different value trajectories if one has stronger tenant retention or lower operating costs.
Which Miami neighborhoods and submarkets are forecast to appreciate most in 2026?
Look for neighborhood-level demand and supply signals rather than assuming one area will lead across every property type. Coconut Grove and Coral Gables have tight inventory in a high-end housing tier, while Pinecrest listings show buyers negotiating leverage. For commercial assets, compare the submarket’s tenant base, competing properties nearby, and lease activity. A residential neighborhood’s price advantage alone does not establish a commercial appreciation forecast.
How do Miami’s 2026 commercial property forecasts compare with other Florida and U.S. markets?
Miami’s third-place national real estate prospects ranking puts it ahead of most surveyed U.S. markets, while the Southeast’s average prospects rating was 2.90 on a five-point scale. Florida comparisons still matter: Fort Lauderdale’s forecast job and income growth rates exceed Miami’s. Investors assessing South Florida can compare these economic signals alongside each property’s tenant demand and operating outlook, rather than treating the region as one uniform market.
What local economic, population, and infrastructure trends could drive Miami commercial property values in 2026?
Miami-Dade’s population growth, international interest, and limited land availability can support demand for commercial space. Infrastructure matters when it improves access: businesses value connections to workers, customers, suppliers, and logistics routes. For a specific asset, assess its proximity to the people and businesses it serves and whether access supports leasing demand. Priorities differ by property type, since office tenants and industrial users value different location advantages.
Leave a Reply