The highest gross rental yield doesn’t automatically mean the strongest monthly cash flow. Finding high cash flow rental properties in Miami starts with a simple calculation: rental income minus operating expenses and debt service. Homestead and South Dade properties show gross rental yields of 7.0-8.0%, but the income left after costs depends on the property and its ongoing expenses.
That distinction matters. An attractive rent estimate can look less compelling after accounting for vacancy, insurance, taxes, maintenance, and condo or homeowners association fees. A neighborhood’s appeal to renters is only part of the picture: purchase price, property condition, and competition also shape the numbers.
This guide explains how to calculate cash flow and compare Miami submarkets by rental demand, competition, maintenance considerations, and cap rates. You’ll see how areas such as South Dade, Doral, Brickell, and Wynwood differ, and why a lower cap rate may still fit an investor’s priorities. The goal is to give you a clearer way to assess opportunities and focus on properties whose income and costs align with your investment plans.
Key Takeaways
- Calculate cash flow by accounting for operating costs and debt service, not just projected rent.
- Compare Miami neighborhoods by tenant demand, competition, purchase costs, and the property types renters seek.
- Factor condition, insurance, taxes, maintenance, and association fees into your income estimate before judging a property’s potential.
- Use cap rates to compare submarkets, then weigh the income picture against your investment priorities.
Miami rental-market factors and neighborhood selection
Which Miami-area neighborhoods offer affordable investment properties with strong rental demand? Investors assessing high cash flow rental properties in Miami should compare renter demand with purchase prices and operating expenses.
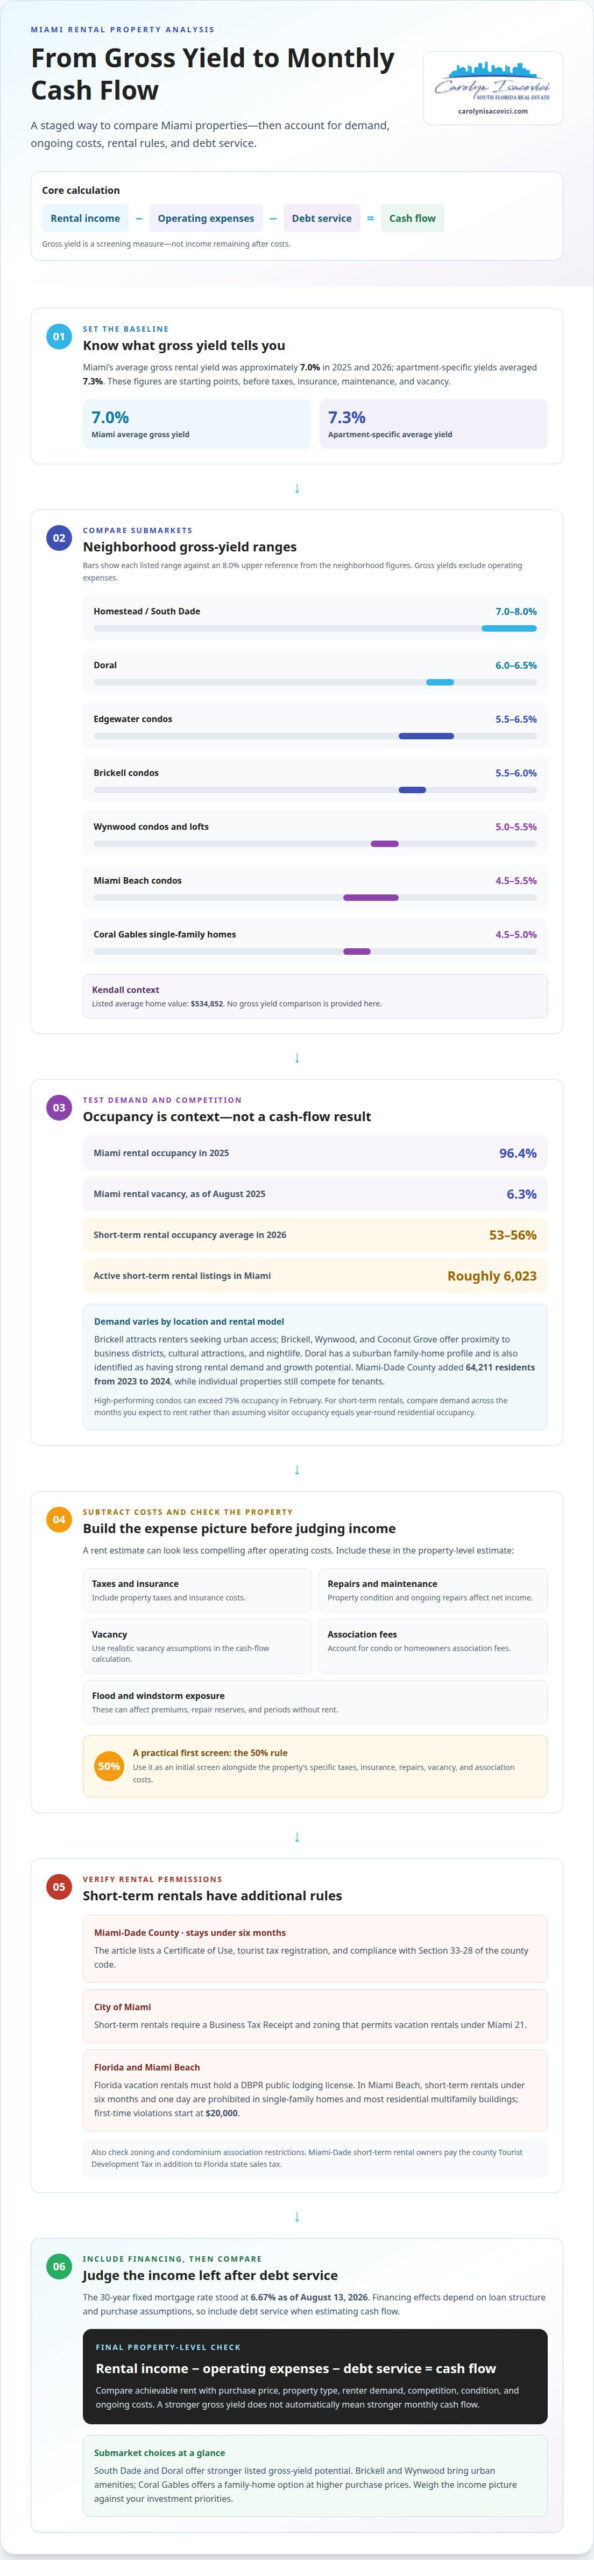
Miami’s average gross rental yield was approximately 7.0% in 2025 and 2026, while apartment-specific yields averaged 7.3%. These are starting points, not net returns after taxes, insurance, maintenance, and vacancy.
Neighborhood Rental Returns and Occupancy
Occupancy offers context for expected rent, but doesn’t establish cash flow alone. Miami’s rental occupancy was 96.4% in 2025; high-performing condos can exceed 75% occupancy in February. Brickell, Wynwood, and Coconut Grove attract renters with access to business districts, cultural attractions, and nightlife, while Doral offers a suburban family-home profile.
Neighborhood Rent-to-Price Ratios
Compare gross rent with the purchase price before expenses. These figures can help screen high cash flow rental properties in Miami, but they do not represent net income.
Gross Rental Yields by Neighborhood
South Dade’s listed gross yield range is 7.0-8.0%. Doral is at 6.0-6.5%; Brickell condos range from 5.5-6.0%, and Edgewater condos from 5.5-6.5%. Wynwood condos and lofts are at 5.0-5.5%, while Coral Gables single-family homes are at 4.5-5.0%. Gross yields exclude operating expenses.
| Neighborhood | Property and price context | Gross yield |
|---|---|---|
| Homestead / South Dade | 7.0-8.0% | |
| Doral | 6.0-6.5% | |
| Brickell | 5.5-6.0% | |
| Wynwood | 5.0-5.5% | |
| Miami Beach | Condos | 4.5-5.5% |
| Edgewater | Condos | 5.5-6.5% |
| Coral Gables | 4.5-5.0% | |
| Kendall | Listed average home value: $534,852 | Not compared here |
Neighborhood Investment Strategies
Compare South Dade and Doral for stronger gross-yield potential, then weigh expected rent against expenses. Brickell and Wynwood offer urban amenities, while Coral Gables provides a family-home option at higher purchase prices. Choose by balancing yield, property type, renter demand, and operating costs.
Miami rental market demand and competition
Tenant demand varies by location and rental model, so compare likely occupancy with competition and operating costs. To assess potential positive cash flow, estimate achievable rental income rather than relying on neighborhood popularity alone.
Location and Tenant Demand
Proximity to employment, cultural attractions, and everyday services can shape renter interest. Brickell draws tenants seeking urban access, while Doral is identified as a Miami-area neighborhood with strong rental demand and growth potential. Miami-Dade County added 64,211 residents from 2023 to 2024, supporting a broad residential demand picture, though individual properties still compete for tenants.
Short-term rentals have additional requirements. In Miami-Dade County, stays under six months require a Certificate of Use, tourist tax registration, and compliance with Section 33-28 of the county code. Within the City of Miami, a short-term rental requires a Business Tax Receipt and zoning that permits vacation rentals under Miami 21. Florida vacation rentals must hold a DBPR public lodging license.
Vacancy Rates and Rental Demand
Miami’s rental vacancy rate was 6.3% as of August 2025. By comparison, short-term rental occupancy averages 53 to 56 percent in 2026, showing why visitor demand shouldn’t be treated like year-round residential occupancy. Miami’s short-term rental market has roughly 6,023 active listings, so competition can affect booked nights and income.
Timing matters. Compare demand across the months you expect to rent, then assess whether seasonal bookings support your annual income assumptions. The 30-year fixed mortgage rate stood at 6.67% as of August 13, 2026. Financing options and the effect of borrowing costs depend on the loan structure and purchase assumptions; include debt service when estimating cash flow.
Miami Rental Property Types
What rental property types in Miami have the highest cash flow? Single-family rentals in Homestead and South Dade have the strongest listed gross-yield range in the neighborhood comparison. Condos and short-term rentals may attract different tenant groups, but association costs, vacancy, and operating expenses affect net income.
For short-term rentals, Miami-Dade owners pay the Miami-Dade Tourist Development Tax in addition to Florida state sales tax. Compare seasonal income with compliance costs and potential vacancy. For long-term rentals, assess Doral’s renter demand alongside the purchase price, expected rent, and debt service. Choose the model whose demand pattern and expenses best support your cash-flow target.
Property condition and maintenance costs
Operating costs can significantly reduce net income, even when projected rents look strong. When underwriting a Miami rental, include property taxes, insurance, repairs, vacancy, and any association fees alongside mortgage payments.
Rental permissions depend on zoning and condominium association restrictions. In Miami Beach, short-term rentals under six months and one day are prohibited in single-family homes and most residential multifamily buildings; first-time violations start at $20,000.
Flood, windstorm, insurance, and vacancy exposure affect owners through premiums, repair reserves, and periods without rent. Include both insurance costs and realistic vacancy assumptions in your cash-flow calculations.
Budget for recurring expenses
A practical first screen is the 50% rule: estimate that about half of rental income goes to operating expenses, excluding mortgage payments. It’s a rough test, not a property-specific forecast. Replace it with line items for the building’s condition, insurance, taxes, repairs, and management. Long-term rental management fees typically run 8% to 12% of monthly rent.
Annual maintenance and repairs are estimated at approximately 1.0% of an investment property’s value.
Check association costs and condition
Those dues may significantly change the economics compared with a family home without a condo association. Review the fee, building condition, and maintenance needs together. A lower purchase price does not automatically offset recurring expenses.
Property taxes also belong in the operating-cost estimate. Typical annual property taxes for a Miami investment property are approximately 1.33% of its value. Add that amount to insurance, HOA dues, and repair reserves before judging whether projected rent supports positive cash flow.
Miami rental property cap rates by submarket
Cap rates reveal how property income compares with its purchase price before financing. In the 2026 Miami market, multifamily properties in core areas such as Brickell and downtown show lower cap rates than suburban markets such as Kendall and Doral. That contrast helps investors compare income potential across Florida submarkets.
To calculate a cap rate, divide annual net operating income by the property’s purchase price and express the result as a percentage. Net operating income is rental income after operating expenses but before mortgage payments. This makes cap rate useful for comparing properties without different loan structures distorting the comparison.
| Miami submarket type | Examples | Multifamily cap rate |
|---|---|---|
| Core | Brickell and downtown | 4.7% to 5.5% in 2026 |
| Suburban | Kendall and Doral | 5.3% to 6.3% in 2026 |
The suburban range is higher, but that alone doesn’t make every Kendall or Doral property a better investment. Rent, vacancy, property condition, taxes, insurance, and association costs all affect operating income. Compare properties using the same expense assumptions, and use realistic rent estimates rather than asking rents alone.
Cap rate is not the same as monthly cash flow. A property with a higher cap rate may still produce limited cash after debt service, and financing terms affect the income left to the owner. For a clear comparison, calculate net operating income first, divide it by the purchase price, then subtract mortgage payments separately from monthly income.
Use Miami’s submarket ranges as a screening tool, not a substitute for property-level analysis. When comparing Miami real estate opportunities, match each cap rate with the property’s condition, tenant demand, and operating costs. The strongest fit is the one whose income profile and expenses support your investment strategy, not simply the one with the highest percentage.
Florida Commercial Investment Properties: Commercial Property Sales
Florida Commercial Investment Properties connects Miami market analysis with property purchases through its investment property sales services. After comparing submarket cap rates, rental demand, and operating costs, buyers can explore Investment Property Sales to pursue an acquisition. Buyers considering rental homes can also explore Residential Real Estate Sales, while Commercial Property Sales may suit commercial asset goals.
Bring your priorities into the decision: target neighborhood, property type, expected income, and expense assumptions. Those criteria help focus the search on assets that align with your investment plan, rather than yield alone. For a conversation about property opportunities, contact Florida Commercial Investment Properties.
Put Your Investment Plan Into Motion
A stronger investment decision starts with a clear buy box: the property type, location, income goals, and expenses that fit your strategy. Use those priorities to narrow your next move, whether you’re evaluating residential opportunities, commercial assets, or a new-construction purchase. Building a portfolio of high-cash-flow rental properties in Miami takes more than finding an appealing listing; it means matching each acquisition to how you plan to hold and operate it.
Florida Commercial Investment Properties offers Commercial Property Sales, Residential Real Estate Sales, and New Construction Homes. If you’re ready to discuss a potential property acquisition, start a conversation with Florida Commercial Investment Properties. A thoughtful next step can turn your market research into a focused investment plan.
Frequently Asked Questions
How do I calculate cash flow on a Miami investment property?
Calculate monthly cash flow by subtracting operating expenses and debt payments from collected rent. Start with rent you reasonably expect to collect, then account for vacancy, taxes, insurance, repairs, management, and association dues. Separate recurring costs from occasional repairs so a quiet month doesn’t hide upcoming maintenance. Keep the calculation specific to each property, since building condition and rental setup affect the result.
What is cash-on-cash return, and why does it matter for financed deals?
Cash-on-cash return measures annual pre-tax cash flow against the cash you invested, including the down payment and eligible acquisition costs. It matters when financing is involved: debt payments reduce the income left for you, and borrowing means your cash investment differs from the property’s full purchase price. Compare properties using similar financing assumptions; otherwise, the comparison may reflect different loan structures rather than stronger operations.
What are current Miami home prices and rents by neighborhood?
Doral’s listed average home value is $548,839. Compare like with like, since condo, townhouse, and detached-home prices and rents describe different segments.
Which Miami neighborhoods have the best rent-to-price ratios?
To compare rent-to-price ratios, divide annual rent by the purchase price, then assess expenses separately. This quick screen can identify candidates, but it doesn’t account for vacancy, taxes, insurance, repairs, or financing costs.
What is the average gross rental yield in Miami?
Miami’s average gross rental yield across property types was approximately 7.0% in 2025 and 2026; apartment-specific yields averaged 7.3% over the same period. Gross yield compares annual rent with purchase price before operating expenses and financing. Treat the citywide figure as a broad benchmark, then compare the property’s expected rent and acquisition cost to evaluate its individual profile.
How do Miami property taxes, insurance, HOA fees, and maintenance affect cash flow?
These costs reduce operating income before mortgage payments, so list them separately rather than relying on rent alone. For a condo, include association dues; for a home, budget for repairs and insurance. Property taxes depend on assessed value and location, while insurance reflects the asset and its exposure. Update estimates when the property’s condition or coverage changes.