Compare commercial property cap rates in Florida by dividing a property’s annual net operating income (NOI) by its market value. NOI is potential gross income minus vacancy and collection losses and operating expenses; it excludes debt service. The result is a percentage that relates a property’s income to its value, not a verdict on whether it is a sound investment.
That distinction matters. A higher rate may look appealing, but property type, location, income, expenses, quality, and condition all shape a fair comparison. Learn how to calculate a cap rate, use it to estimate value, and identify the property and investment factors that warrant closer review.
Market movement adds another useful perspective, as long as national trends aren’t mistaken for Florida-specific figures. From Q4 2024 to Q4 2025, national multifamily cap rates were unchanged, industrial rates fell by 0.1%, office rates rose by 0.2%, and retail rates rose by 0.1%. The guide explains what those shifts can and can’t tell you when evaluating commercial property in Florida.
Key Takeaways
- Calculate cap rate using annual net operating income and current market value, keeping debt costs and major capital projects separate from NOI.
- Use national market movements as context, not as a direct substitute for Florida-specific property comparisons.
- Weigh potential returns alongside investment risk, property condition, and the time it may take income to recover the investment.
- Compare like-kind properties by type, location, size, income, expenses, quality, and condition to make the figures more meaningful.
Cap rate calculation using net operating income and property value
A cap rate compares a commercial property’s annual net operating income with its value. It gives investors a consistent way to assess income relative to value, as long as both inputs reflect the property’s current circumstances.
Calculating Net Operating Income
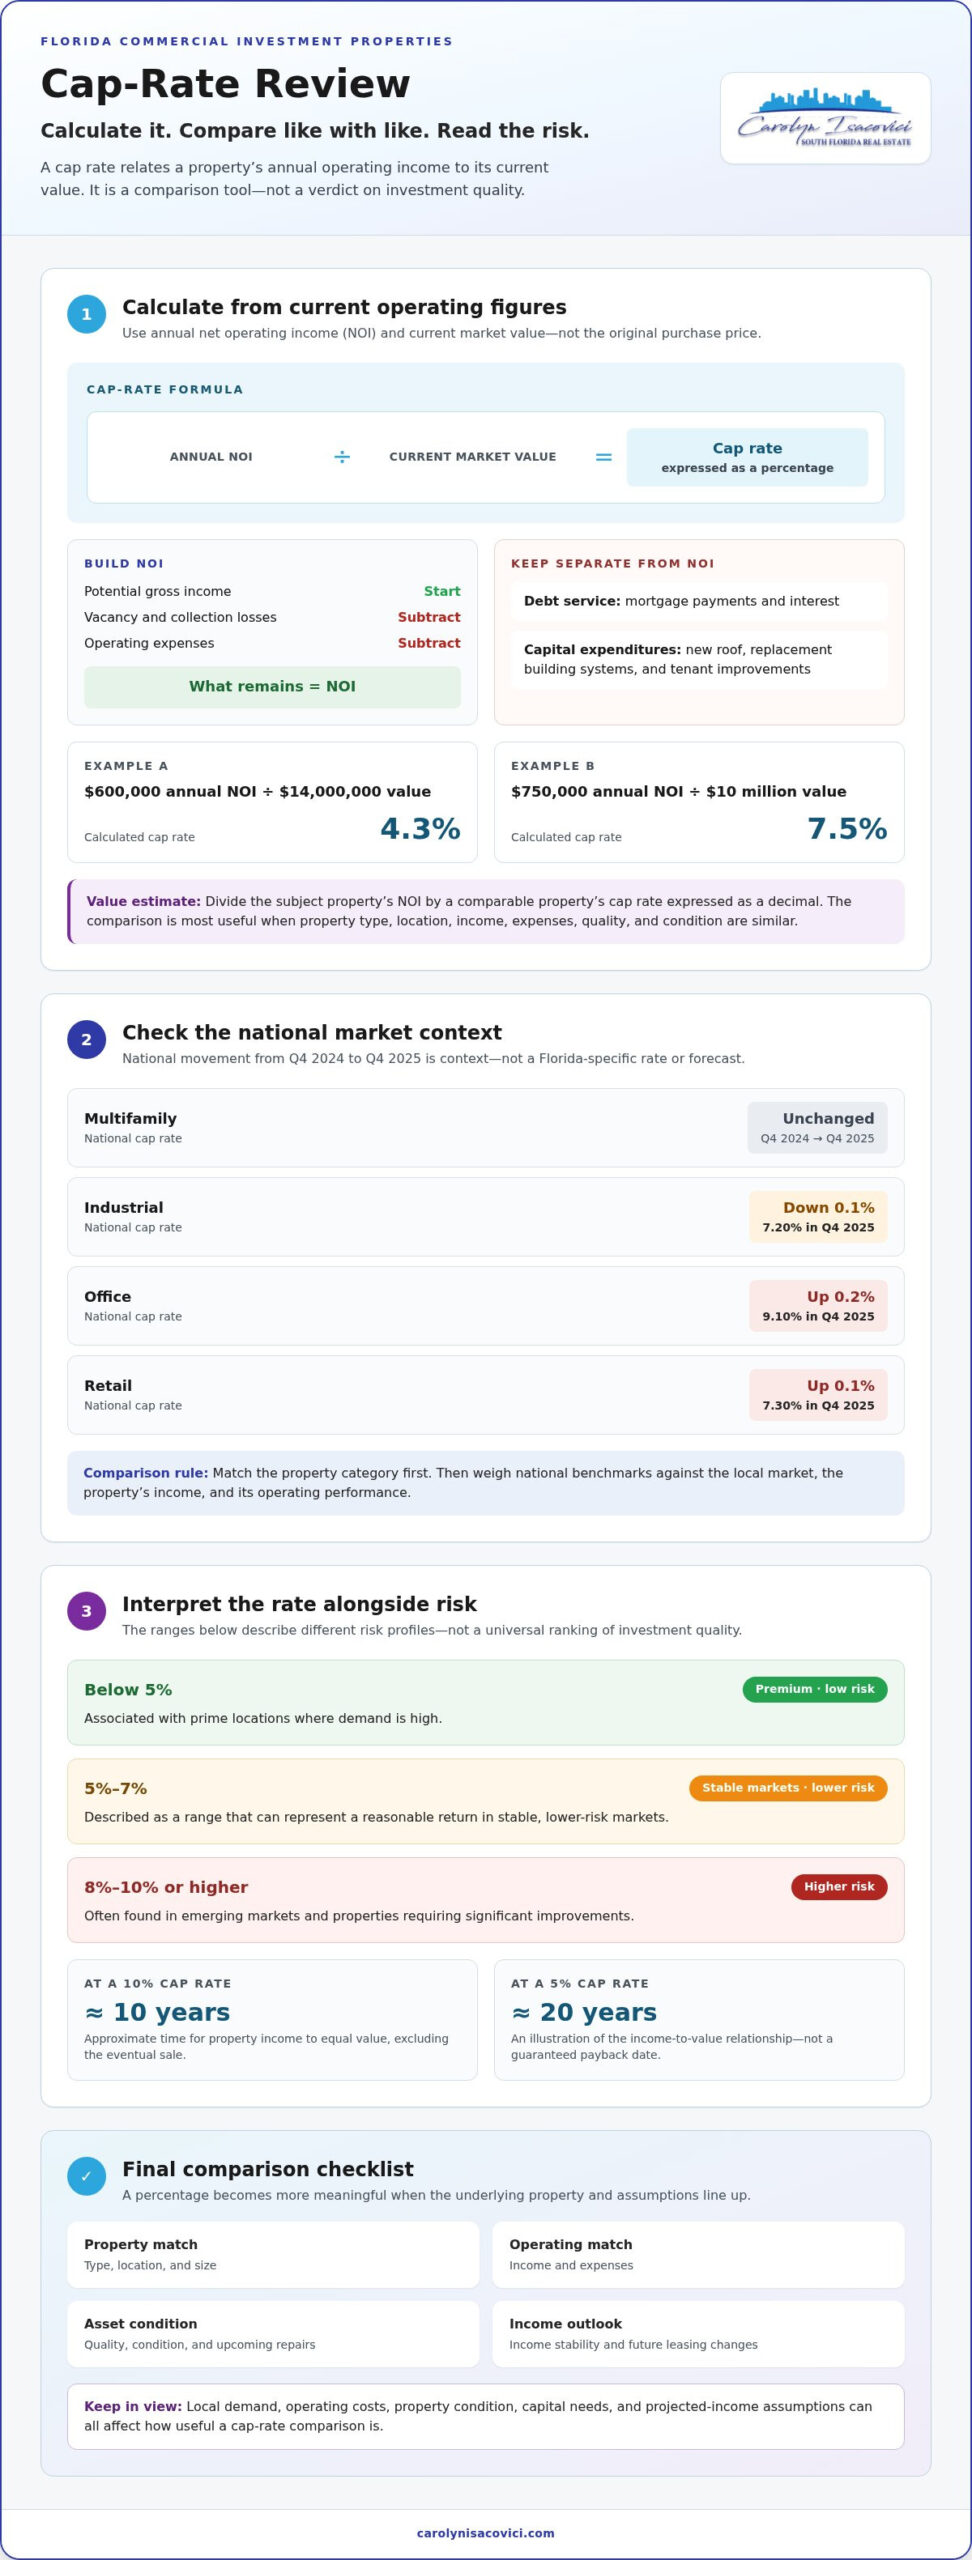
Net operating income is potential gross income minus vacancy and collection losses and operating expenses. Start with the income the property could generate, account for lost income, then subtract the costs of operating it. Exclude debt service, including mortgage payments and interest, as well as capital expenditures such as a new roof, replacement building systems, and tenant improvements. Separating these items helps you compare operating performance without confusing financing or major improvement costs with routine income and expenses.
Applying the Cap Rate Formula
Divide annual net operating income by property value, then express the result as a percentage. For example, a property valued at $14,000,000 with annual NOI of $600,000 has a 4.3% cap rate. A property with $750,000 in NOI and a $10 million market value has a 7.5% cap rate. The formula makes income and value easier to compare, but the result depends on using consistent, current figures for both inputs.
Which value should you use? For a property acquired several years ago, use its current market value, not its original sale price. The purchase price reflects an earlier transaction, while current market value gives the calculation a present-day basis. This distinction can materially change the resulting percentage even if the property’s NOI stays the same.
The same relationship can help estimate value. Apply a comparable property’s cap rate to the subject property’s NOI by dividing NOI by the rate expressed as a decimal. The estimate is most useful when the comparison reflects a similar property type, location, income, expenses, quality, and condition. Treat it as an income-based comparison, not a substitute for examining the property and its operating figures.
Cap-rate changes from Q4 2024 to Q4 2025
Over five years, Florida cap-rate changes vary by asset type, location, income, and operating costs; one statewide trend can obscure those differences. The comparable figures below show national movement from Q4 2024 to Q4 2025, not Florida-specific rates.
Tracking Cap Rate Changes Over Time
Tracking cap-rate changes means comparing the same property category across consistent dates. It helps separate broader market movement from changes in an individual property’s income or value. From Q4 2024 to Q4 2025, the national multifamily cap rate was unchanged. Industrial declined by 0.1%, office increased by 0.2%, and retail increased by 0.1%. These are national benchmarks, not Florida measurements. For a Florida property, consider them alongside its local market, property type, and financial performance, rather than treating them as a statewide forecast.
Industrial, Office, and Retail Examples
National industrial cap rates were 7.20% in Q4 2025, down 0.1% from Q4 2024. Office rates reached 9.10%, up 0.2%, while retail rates reached 7.30%, up 0.1%. These examples show why property type matters: applying an office benchmark to an industrial asset compares unlike properties. Start with the matching category, then consider comparable assets and the subject property’s operating performance.
Cap rates have limits. A single percentage summarizes income relative to value, but doesn’t capture future leasing changes, upcoming repairs, or the assumptions behind projected income on its own. National annual movement also doesn’t establish a Florida property’s likely value. Local demand, property condition, income stability, and operating costs all influence how useful a comparison will be. For example, a national retail increase of 0.1% provides context, but doesn’t explain why a specific Florida retail property’s income or value may differ. Treat market movement as one comparison point, then assess the property and its local conditions.
Other factors to consider in investment decisions
A cap rate gives a rough view of how long property income would take to equal its value. At a 10% cap rate, the approximate recovery period is 10 years, excluding the eventual sale. At 5%, the approximate period is 20 years. These illustrations assume a simple relationship between income and value, not a schedule of cash distributions. Operating changes and capital needs affect ownership beyond the cap-rate calculation. Use the period to frame income potential, not as a guaranteed payback date.
Risk changes how investors interpret a percentage. According to Latitude Commercial, a 5%-7% cap rate can represent a reasonable return in stable markets with lower risk. Cap rates below 5% indicate premium, low-risk investments in prime locations where demand is high. Rates of 8%-10% or higher are often found in higher-risk investments, including emerging markets and properties requiring significant improvements. These benchmarks describe different risk profiles, not a universal ranking of investment quality.
Economic cycles also shape investment decisions. No interest rate hikes occurred in 2025, but that fact alone doesn’t show whether a Florida property became more attractive or less risky. Investors still need to examine how dependable the property’s income is, whether operating expenses could change, and what improvements may be needed. A stable cap rate can’t remove uncertainty about future occupancy or costs. Consider market conditions alongside the asset’s actual income drivers.
Before judging a potential return, connect the percentage to the investment plan. Compare the expected income with the holding period, required improvements, and tolerance for uncertainty. For example, a property with a 10% cap rate may suggest a shorter simple recovery period than one at 5%, but its higher rate may reflect greater risk. Review the source of that difference: income stability, property condition, or market demand. That analysis makes a cap rate more useful than treating the largest percentage as the automatic choice.
Property-specific factors to consider when comparing cap rates
A useful comparison starts with matching the assets and market context. Property type, location, income, expenses, quality, condition, and size all affect what a cap rate can tell you.
Comparing Property Types and Locations
Compare properties in the same asset class and location before drawing conclusions. An industrial property and a retail property may have different income and expense patterns, so their rates are not a like-for-like comparison. Location matters too: properties in different markets can face different demand and operating conditions. For Florida assets, identify the relevant local market, then interpret each rate in light of the property’s characteristics. This prevents broad comparisons from obscuring important differences.
Comparing Similar Commercial Properties
Cap-rate comparisons are most useful for properties similar in asset class, location, and size. Use those factors as an initial filter, then compare income, expenses, quality, and condition. For example, two similarly sized properties in the same market may still differ if one has weaker income or needs more work. Each difference can affect the value of the comparison. A closer match helps you assess whether a rate reflects the market or the asset’s specific profile.
Build the comparison using consistent information. First, group properties by type and local market. Next, narrow the group by size and condition. Then examine each asset’s income and operating expenses. If a property’s income is less dependable or its condition differs materially, account for that before interpreting its rate. This makes the reasons for a gap easier to identify, rather than treating the percentage as a verdict on its own.
Use cross-category figures as context, not direct substitutes for comparable properties. A Florida retail asset should be assessed against similar retail assets in a relevant location, rather than a different property type simply because its rate looks attractive. The same principle applies when evaluating an acquisition or sale: align the property characteristics first, then judge what the income-to-value relationship suggests. Explore commercial property opportunities with those comparison factors in mind.
Florida Commercial Investment Properties: Commercial Property Sales
Florida Commercial Investment Properties can help when cap-rate comparisons inform a buying or selling decision. Its Commercial Property Sales and Investment Property Sales services connect your analysis to a property transaction, whether you’re assessing an acquisition or preparing to sell. Cap rates frame income relative to value, while property type, location, condition, and operating performance help explain how a specific asset compares.
Bring those comparison factors into the conversation when you’re considering a commercial property purchase or sale. They provide useful context for evaluating opportunities and aligning property decisions with your investment priorities. For a conversation about commercial real estate goals, visit carolynisacovici.com.
Turn your market insight into a clear next step
Understanding commercial property cap rates in Florida can sharpen your perspective, but the next decision is personal: which opportunities fit your investment priorities, timing, and appetite for risk? Use your analysis to clarify what matters most in a property, then carry those priorities into your next real estate decision.
Florida Commercial Investment Properties offers Commercial Property Sales, Residential Real Estate Sales, and New Construction Homes. If you’re weighing a commercial transaction or considering how real estate fits your plans, a conversation can help you focus on the path ahead. Contact Florida Commercial Investment Properties to discuss your real estate goals and take your next step with greater clarity.
Frequently Asked Questions
What Is a Cap Rate?
A cap rate is a percentage investors use to assess a property’s operating income relative to its value. It can help screen an opportunity before a deeper review. For example, if two properties have similar asking values, comparing their cap rates can show which produces more operating income relative to value. The percentage is a starting point for analysis, not a complete measure of an investment’s suitability.
What are Florida cap rates by city and metro area, including Miami, Tampa, Orlando, and Jacksonville?
Florida cap rates vary by property and local market, so compare similar assets in the same area. In Miami, Miami Beach, Fort Lauderdale, Palm Beach, or Melbourne, consider property type, income, expenses, size, quality, and condition together. A city name alone does not explain a property’s income potential or investment risk. Local comparisons are more useful when the assets share relevant characteristics.
How do Florida cap rates compare with national averages and other Sun Belt states?
Use national figures as context, not as a direct measure of a Florida property. In Q4 2025, national cap rates were 6.10% for multifamily, 7.20% for industrial, 9.10% for office, and 7.30% for retail. Comparing commercial property cap rates in Florida with national or Sun Belt markets is most useful when property type, location, and measurement period align. Differences can reflect asset and market characteristics.
What cap rates are typical for Florida multifamily properties by class and market?
Broad class benchmarks place Class A commercial properties at 4% to 8%, Class B at 6% to 9%, and Class C at 7% to 10%. These ranges offer context, not a fixed Florida multifamily rate for every market. In Miami, Palm Beach, or another Florida location, class, property condition, income, expenses, and local demand can all affect how a multifamily asset compares.
What cap rates are typical for Florida retail, office, industrial, and hotel properties?
Property type matters, and national Q4 2025 figures provide a reference for retail, office, and industrial assets: 7.30%, 9.10%, and 7.20%, respectively. Those figures aren’t Florida-specific rates. A hotel’s income and operating profile also needs its own comparable-property context. For a Florida asset, compare its category and local market first, then consider its income, expenses, quality, and condition before drawing conclusions.
How do property location, age, occupancy, lease terms, and condition affect Florida cap rates?
These characteristics shape the income and risk behind a property’s rate. Location determines the relevant comparison set, while age and condition help frame building quality and potential improvement needs. Occupancy influences current rental income, and lease terms shape how that income is structured. For example, compare a well-maintained, highly occupied Miami property with similar local assets, rather than with a differently leased property in another market.